
In Highland Council, Glen Urquhart High School had the highest percentage of school leavers earn five or more Highers last year at 61%.
It was the best result in Highland Council, and fourth overall in the north and north-east.
On the other end of the league table, Inverness High School only reported 12% of leavers with five or more Highers.
While some have argued that exam results are not the best measure of a school, universities put stock in how many qualifications students earn. We created our first School League Table by analysing these statistics across the north and north-east.
Here, we take a deeper dive into the makeup of each school and consider how location, student demographics, and school enrollment may play a role in these very different outcomes.
A sense of place
Glen Urquhart and Inverness are a mere 15 miles apart, down a stretch of the A82 that overlooks the River Ness and the iconic loch.
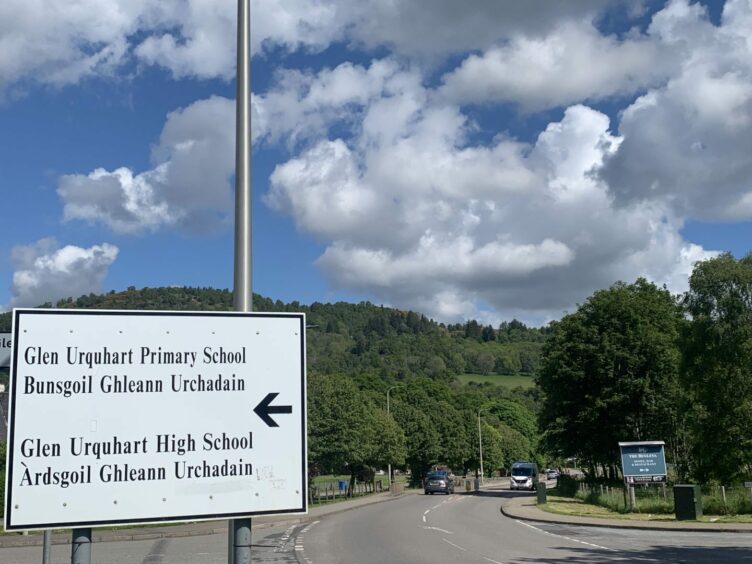
The high school is nestled into a glen in Drumnadrochit, a scenic village on the loch that’s a perennial tourist destination.
The primary school is next door, and the campuses blend together almost seamlessly.

Tourists flock to the inns in town, and gather for meals at the nearby cafes or crowd onto the cruise ships for scenic tours.
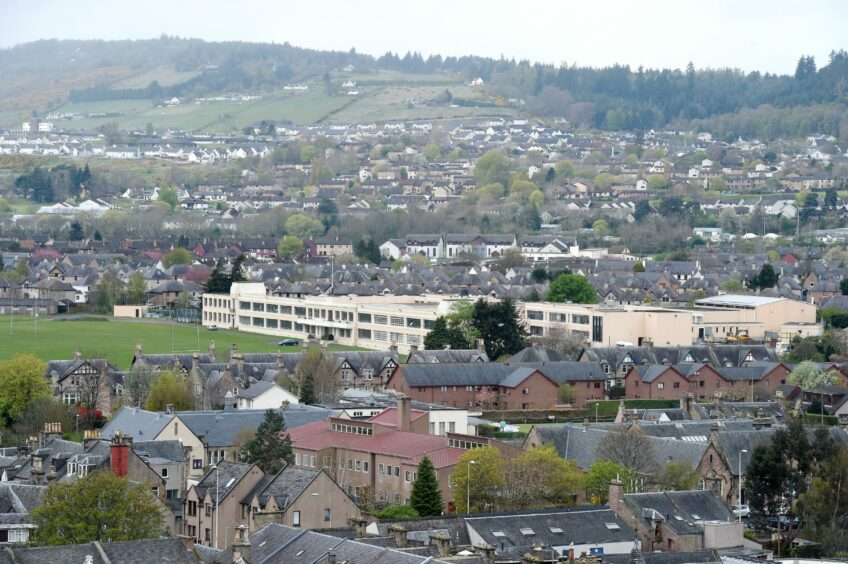
Meanwhile, Inverness High sits in the heart of the city, near where the River Ness empties into Moray Firth. The green hills are visible, but distant.
Nearby are city blocks with row after row of bed and breakfasts. They mostly cater to adventurers looking to use the only city in the Highlands as a base for exploring nature.
Different sizes and makeups
Inverness High School has a capacity of 677 students and is roughly 75% full with just over 500 enrolled.
Glen Urquhart meanwhile, is almost half the size and less crowded. With 211 students enrolled, it’s just over half of its 368-student capacity.
Between 80-90% of Inverness High School students live in what the Scottish Government considers deprived areas. The government bases these statistics on area income and access to opportunities and resources such as health and education.
On the other hand, less than 10% of Glen Urquhart’s students are listed in this category.
It is hard not to wonder how much this discrepancy played in the exam performance gap.
Highland school league table: beyond the results
Alongside the publication of our league tables, a Highland Council spokesperson pointed out the other ways to measure a school’s success.
“The statistical data alone, while indicating room for improvement, does not reflect all that the school is doing in terms of achievement, wellbeing and positive destinations.”
And yet, council education officers have discussed worrying trends in senior phase exam results in recent years.
But judgments based on exam results have become even more convoluted since the Covid-19 pandemic.
Instead, positive destinations are becoming a more popular way to measure achievement. And education leaders often use it to measure school success.
The positive destination rate measures students who go on to work, training or further education. If less than five students at a school do not go on to positive destinations, the government suppresses the exact number to protect students’ identities.
Closer than they appear
Despite the 49-point gulf between Inverness and Glen Urquhart when it comes to Higher results, the schools are much closer in terms of positive destinations.
In 2021, Glen Urquhart sent so many pupils on to positive destinations that the number couldn’t be reported. It’s been much the same since the 2016 school year. Glen Urquhart can even boast a rate of 100% from 2018.
Meanwhile, Inverness High School reported that 85% of its school leavers went on to positive destinations later.
Although still below Glen Urquhart, the gap is far slimmer than the one with Higher results. Inverness leavers were also clearly impacted by the Covid-19 pandemic.
Between 2016-2019, Inverness posted positive destination rates that climbed from 91% to almost 100%. In 2020, the first pandemic-shortened year, that number fell to 73% but is already on the way up again.
Time will tell the full story
Even in the years when more than 90% of Inverness students went on to positive destinations, rates of five or more Highers were still below 15%.
Students headed straight into careers or for training on a career path are less likely to sit Higher exams.
With the Covid-19 pandemic causing havoc on so many sectors of the economy, it’s hard to know whether a dip in positive destinations means a dip in achievement or that there were simply fewer opportunities to go around.
And differences in income, positive destination rates and school enrollment mean that each school is going to feel these pressures differently.
The SQA exam system is still in flux, but this year’s return to standardised exams is a step towards normalisation. With a few more years of regular schooling, parents, students and teachers will be able to paint a much clearer picture of school performance.


Read more from the Schools & Family team
School league tables: What puts Banchory top and Turriff bottom in Aberdeenshire?
Cults and Northfield: One city, two different worlds
Real Life Parenting Dilemmas: How much pressure should you put on your child’s exam scores?


Conversation