The number of positive cases of Covid-19 has been rising again with some record breaking numbers following Scotland’s move beyond level zero.
But how has the rise in cases impacted the north and north-east?
Our interactive charts show the spread of Covid-19 and the change in circumstances in neighbourhoods across the area from the start of June to the end of August.
How have cases changed across Scotland?
Restrictions were eased further on August 9, seeing the reopening of some settings that have been closed since the start of the pandemic, and the further relaxing of other rules.
Since this date, there has been a sharp rise in the number of reported positive cases, peaking at 7,113 on August 29. This was partly attributed to a delay in cases being reported due to high testing numbers, with some cases coming from more than 48 hours prior to the day.
Some of the daily case numbers recorded since the move to beyond level zero are the highest seen throughout the entirety of the pandemic so far.
Cases in the north and north-east
At the start of June, cases remained fairly low across the board, with many areas reporting no case rate due to having between zero and two cases in a seven-day period, however cases are increasing again.
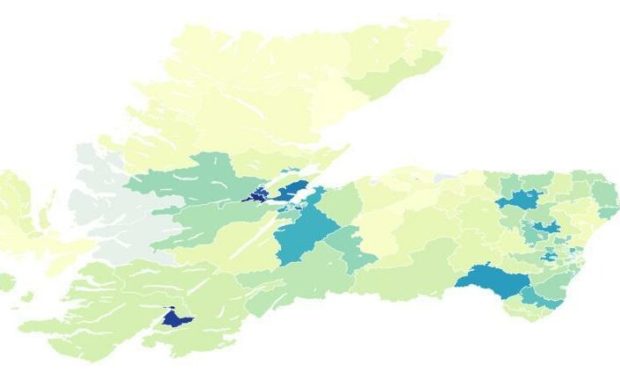
Our interactive map below shows each neighbourhood in the north and north-east and how case rates have changed in the past two months, where the darker a region is, the higher case rate it has.
A greyed out neighbourhood indicates that there was between zero and two cases and as a result any data has been suppressed.
Since the start of June, Fort William has had the top five highest case rates in the north and north-east.
On August 25, it recorded a case rate of 2206.69 per 100,000 population, on August 26, a case rate of 2184.84 per 100,000 population, and a case rate of 2,119.29 on August 27.
Garlogie and Elrick also saw high case rates in the past few months, with a case rate of 1987.77 per 100,000 population on June 21, and a rate of 1962.28 per 100,000 population on June 22.
Of the top 20 highest case rates recorded from the start of June to the end of August in Aberdeen, Aberdeenshire, Moray and the Highlands, 19 of the 20 were recorded in either Garlogie and Elrick or Fort William.
West End in Aberdeen also made the top 20 highest rates between this period, with a seven day case rate of 1206.47 cases per 100,000 population.
Have hospitalisations been affected?
As more people continue to be vaccinated, the number of people in hospital with confirmed Covid-19 has not reached the same levels as seen in previous waves of the virus.
Select the health board you are interested in from the chart below.
In the NHS Grampian health board, hospitalisations were at their highest recently on July 23, with 51 people reported to be in hospital with confirmed Covid-19, although numbers remained significantly lower than at the start of the year.
This fell in August, but began rising again at the end of the month, where 24 people were in hospital on August 31.
Meanwhile, there has also been people in ICU, the highest number recently being 8 on August 3.
In NHS Highland, numbers of hospitalisations are lower, but have been peaking again in the past few months.
The highest number of hospitalisations, 22, was on July 26, and were rising towards the end of August with 20 people in hospital due to Covid-19 on August 31.
The number of people in ICU has remained low however, although on August 4 and 5 there was six people in ICU on both days.
Deaths in Scotland
Like hospitalisations, despite the rise in cases, the number of deaths from coronavirus has not been as high as seen in previous high waves of the virus.
A number of days in the past few months saw no deaths, while the highest number of deaths registered recently was 22, on July 22.
In comparison, the highest number of deaths seen in one day in the last wave of coronavirus was 92, on January 27.
To find out more about Covid-19 in Scotland see our tracker.
For more information on the vaccination rollout in Scotland, click here.