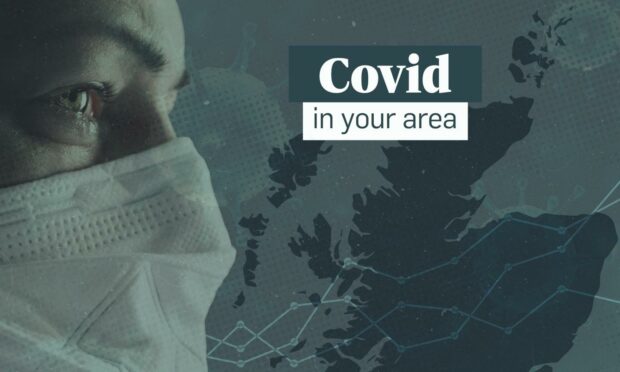
As 2021 is coming to an end, more restrictions have been imposed to halt the spread of coronavirus over the festive period.
People have been urged to limit social visits wherever possible, and this week new restrictions coming into force on Boxing Day were announced – including limits being put on large public events.
Omicron has also now become the dominant variant of coronavirus in Scotland.
But how have all these things impacted on case rates?
Our interactive maps below show the case rate by intermediate zone for Aberdeen, Aberdeenshire, Highland and Moray. The islands have not been included as case numbers tend to be very low and are often suppressed as a result.
Each intermediate zone (IZ), represents an area, quite often a neighbourhood, within each local authority.
Hovering over each area will give additional information including the population of each neighbourhood, how many positive cases have been recorded there in the past seven days, and the seven-day case rate per 100,000 population – a measure which is used to compare areas with different populations against each other to accurately track the spread of the virus.
Below includes details for case rates accurate as of December 20, which was the latest information at the time of writing, as this data is subject to a three-day lag in being uploaded by Public Health Scotland.
We have compared case rates to previous weeks to provide context about whether cases are rising or falling in your area.
What are case rates like in Aberdeen?
The below chart shows the case rates for each neighbourhood in Aberdeen.
The three neighbourhoods in the city with the highest case rates were Kingswells, West End North and Denmore.
Kingswells had a rate of 1043 per 100,000 population, with a total of 65 positive cases in the previous seven day period, out of a population of 6,232.
Meanwhile, West End North had a case rate of 982.8 per 100,000 population, with 36 Covid-19 cases out of a population of 3,663 and Denmore had a case rate of 897.67 per 100,000 population. It had 35 positive cases in a population of 3,899 in the previous seven days.
Last week, the top three neighbourhoods were Balgownie and Donmouth West, Kingswells and Denmore.
What are case rates like in Aberdeenshire?
The below chart shows the case rates for each neighbourhood in Aberdeenshire.
In Aberdeenshire, there was several neighbourhoods with case rates of more than 1,000 per 100,000 population.
The top three were Howe of Alford, Kemnay and Newmachar and Fintray, although Auchnagatt also had a case rate of more than 1,000.
Howe of Alford recorded a case rate of 1,326.88 with 85 positive cases in a population of 6,406 in the previous seven days.
Kemnay had a rate of 1.124.57 per 100,000 population, with 39 positive cases in its population of 3,468. In Newmachar and Fintray, a case rate of 1,059.07 per 100,000 population, and recorded 45 confirmed cases out of 4,249 people.
Last week, the top three neighbourhoods were Balmedie and Potterton, Westhill North and South and Newmachar and Fintray.
What are case rates like in Moray?
The below chart shows the case rates for each neighbourhood in Moray.
Moray has the biggest share of case rate increases in the north and north-east- case rates were up in 18 out of 24 areas compared with the previous week.
In Moray, the neighbourhoods with the highest case rates were Forres South West and Mannachie, Elgin Cathedral to Ashgrove and Pinefield and Findhorn, Kinloss and Pluscarden Valley.
Forres South West and Mannachie had a case rate of 936.01 per 100,000 population, with 49 positive cases in the previous week out of a population of 5,235. Elgin Cathedral to Ashgrove and Pinefield had a slightly lower case rate of 913.68 per 100,000 population, and saw 38 cases in a population of 4,159.
Findhorn, Kinloss and Pluscarden Valley recorded a case rate of 849.26 per 100,000 population, with 32 positive cases in a population of 3,768.
Last week, the top three neighbourhoods were Buckie Central East, Rafford, Dallas, Dyke to Dava and Elgin Central West.
What are case rates like in the Highlands?
The below chart shows the case rates for each neighbourhood in the Highlands.
The top three neighbourhoods in the Highlands with the highest case rates were Badenoch and Strathspey South, Sutherland South and Black Isle North.
Badenoch and Strathspey South had a case rate of 888.42 per 100,000 population, and 34 positive cases in its 3,827 population.
Meanwhile, Sutherland South had a case rate of 857.05 per 100,000 population and 53 confirmed cases out of 6,184 people. Black Isle North had a case rate of 726.87 per 100,000 population and 26 cases in a population of 3,577.
There were two areas for which the data was suppressed, meaning they recorded between zero and two cases in a seven day period. These were Ross and Cromarty North West and Thurso East.
Last week, the top three neighbourhoods were Caithness South, Muir of Ord and Inverness Central, Raigmore and Longman.
How does the north and north-east compare to the rest of Scotland?
The below chart shows the top 10 neighbourhoods in Scotland with the highest case rate per 100,000 population.
No neighbourhoods in either the north or north-east featured on the top neighbourhoods in Scotland with the highest case rates this week.