A new weather map has revealed the stark difference in rain and snowfall between the west and east of Scotland.
The detailed illustrations of Scotland shows where the most precipitation falls through 3D imaging, conveying the wettest areas as peaks.
While most of Scotland, especially around Aberdeen and Aberdeenshire, is remarkably flat, the west coast is peppered with huge spikes.
Created by Professor Alasdair Rae, from Inverness, the maps have now been widely shared online.
Professor Rae, who runs Automatic Knowledge Ltd – a UK-based data, analysis, mapping, and insights company who create data-based images – uses weather data from the Met Office and other sources to build the maps with 3D software.

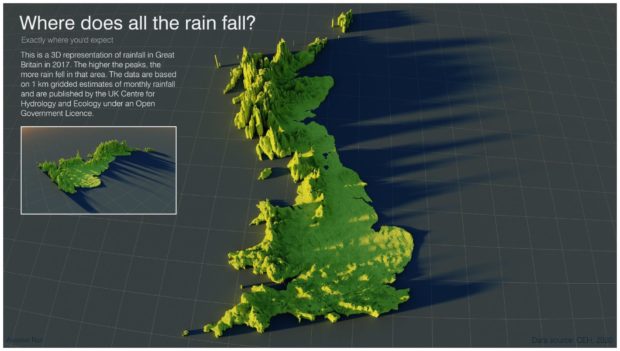
The rainfall map is based on the annual rainfall data published in 2017 by the UK Centre for Ecology and Hydrology.
The data is built around 1km gridded estimates of monthly rainfall and the higher the peaks on the map, the more rain fell in that area.
A similar comparison could be drawn from Professor Rae’s 3D map showing snowfall, where the north and north-west of the country is covered in high peaks of data.
While the very east coast and central Scotland received very little snow fall.
Posting on Twitter, Professor Rae said: “Just in: shocking news about where snow falls in the UK, because it’s been back to visit us these past few days.
“Data = days with greater than 50% of ground covered by snow at 9am, highest values are in the Cairngorm Plateau at over 105 days/year.”
Just in: shocking news about where snow falls in the UK, because it's been back to visit us these past few days
Data = days with greater than 50% of ground covered by snow at 9am, highest values are in the Cairngorm Plateau at over 105 days/year
Source: https://t.co/Xl7FrZNynf pic.twitter.com/QE7lLxFu0G
— Alasdair Rae (@undertheraedar) April 6, 2021
Professor Rae explained his maps in deatail, saying: “I’ve done quite a bit of this kind of 3D mapping recently and of course there are upsides as well as downsides to doing this but I think this does a pretty good job of highlighting the peaks in precipitation and also the general pattern across the areas shown.
“If you enlarge the images you should be able to see things in a lot more detail. The Great Britain map is based on a 1km grid and the US one is based on an 800m grid.”
Because it’s ‘islands’ day as part of #30DayMapChallenge, I decided to make some more ‘rain shadow’ maps, this time using data from the exceptionally soggy month of December 2015 across Great Britain (thread, with a small detour)
peaks = LOTS of rain, squares = 100km pic.twitter.com/Sm0d0276eA
— Alasdair Rae (@undertheraedar) November 16, 2020