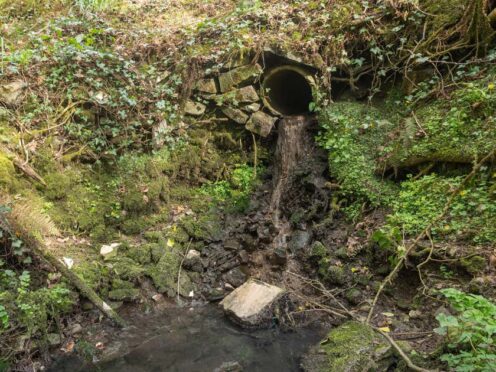
Storm overflows dumped sewage into rivers and seas across England for more than 3.6 million hours in 2023, more than double the previous year, figures show.
The data published by the Environment Agency (EA) reveal there were 464,056 spills in 2023, up 54% from 301,091 in 2022, which the organisation said was partly due to England experiencing its sixth-wettest year on record.
The figures reveal the frequency and duration of spills from storm overflows, which dump untreated sewage into rivers and the sea, usually during heavy rainfall to stop sewers backing up, amid high levels of public concern and anger over the state of England’s waterways and beaches.
They were described as “disappointing” but “sadly not surprising” by the EA while campaigners said the scale of discharges was a “final indictment of a failing industry”.

The duration of the sewage spills had more than doubled from 1,754,921 hours hours in 2022, to 3,606,170 hours in 2023, the figures show.
Both the frequency and duration of spills were also up on 2020 levels, which saw comparable amounts of rainfall.
And the figures are at their highest ever levels, although officials caution that comparisons over the years are difficult as an increasing number of storm overflows have been fitted with monitors over time, and all now have the technology to record spills.
Environment Agency director of water Helen Wakeham said the figures were “disappointing” but “sadly not surprising”.
“We are pleased to see record investment from the water sector, but we know it will take time for this to be reflected in spill data – it is a complex issue that won’t be solved overnight.
“No other country has the level of monitoring we do, with 100% of storm overflows in England now fitted with a monitor.
“We are better placed than ever before to hold water companies accountable – thanks to intelligence from our new whistleblower portal, our plans to expand our specialised workforce, new enforcement powers, increased water company inspections and new tools to inform our enforcement work,” she said.
Water minister Robbie Moore said: “I have been clear that sewage pollution in our waters is unacceptable, which is why in just the last few months we announced a consultation to ban water bosses’ bonuses when criminal breaches have occurred, quadrupled company inspections next year, fast-tracked £180 million investment to cut spills, launched a whistleblowing portal for water company workers to report breaches and will soon set out our plans to ban wet wipes containing plastic.
“We demanded that 100% of overflows were monitored by the end of last year as part of our drive to improve transparency.
“Today’s data shows water companies must go further and faster to tackle storm overflows and clean up our precious waterways.”
In response to the figures, a spokesperson for industry body Water UK said: “These results are unacceptable and demonstrate exactly why we urgently need regulatory approval to upgrade our system so it can better cope with the weather.
“We have a plan to sort this out by tripling investment which will cut spills by 40% by 2030 – more than double the Government’s target.
“We now need the regulator Ofwat to give us the green light so that we can get on with it,” they urged.

The water companies say they want to triple investment to £10 billion over the period 2025-2030 to tackle the problem, which would be paid for through consumer bills.
But clean water campaigner Feargal Sharkey told BBC Radio 4’s World At One programme: “The truth is if anybody is going to be paying for this, any investment at this point needs to be made out of shareholders’ pockets and the public should not put another penny of their money, because we do not want to pay twice for something we have already paid for and didn’t get.”
James Wallace, chief executive of campaign group River Action, said: “The scale of the discharges by water companies is a final indictment of a failing industry.
“Having run amok with billpayers’ money for decades, they discharged untreated sewage into rivers and coastal waters more than 3.6 million hours last year from 464,000 spills through storm overflows that are supposed to be only used in extreme weather events.
“That’s a 105% increase in the number of hours and a 54% increase on spills on the previous year.
He added: “Rather than investing in future-proofing their infrastructure, fixing leaky pipes, upgrading wastewater treatment plants, these international businesses have plundered our most precious natural resource, fresh water.”
He called for reform of environmental regulators and for failing water companies to be refinanced and restructured to put people above profits.

Shadow environment secretary Steve Reed said water company bosses should not be allowed bonuses for “this level of failure”.
He told the PA news agency: “It’s absolutely disgusting to see record levels of raw sewage being pumped out into our lakes, rivers and waterways, and a Government standing back and doing absolutely nothing while this continues.”
The figures also showed there were an average of 33 instances of sewage spills per storm overflow in England last year, up from 23 in 2022.
This is the second highest annual average since data began in 2016, with the highest being 35 spills per overflow in 2019.
The figures are for storm overflows where spill data is available, the Environment Agency said.
