The housing market in Inverness is continuing to heat up, but the city itself is also getting warmer.
The Highland capital has developed rapidly over the last few decades and is continuing to expand.
But that ‘urbanisation’ has had an impact on the temperature of the city compared to surrounding areas.
A ground-breaking study has revealed Inverness can be up to 3.5C warmer than more rural locations and this could rise to up to 7.4°C by 2080.
What’s causing the temperature rise?
The increase in temperature has been attributed to the ‘urban heat island (UHI) effect’, a phenomenon where surfaces such as roads and rooftops absorb and release more heat than those in rural environments.
It can lead to more air pollution and exacerbating conditions like asthma.
Reducing the UHI effect is seen as key to achieving sustainable development within urban areas.
The study recommends further research to determine the scale and behaviour of UHI phenomena in Inverness.
“The results identify a clear need for action to prevent development of UHI effects through the national planning framework and such policy changes should be informed by research.”
Further research is also planned on more sustainable materials used for roads and house building.
It is the first time the effect has been studied in Inverness.
Research is carried out at only a few smaller urban environments across the world, with most focusing on large cities such as New York and Tokyo.
The UHI effect poses more noticeable threats to human populations in these areas, particularly in terms of heatwaves and air quality.
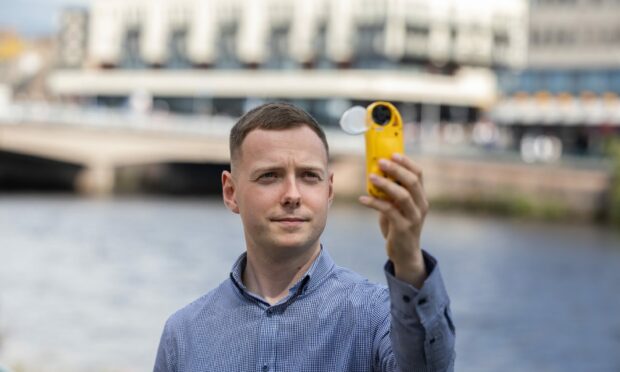
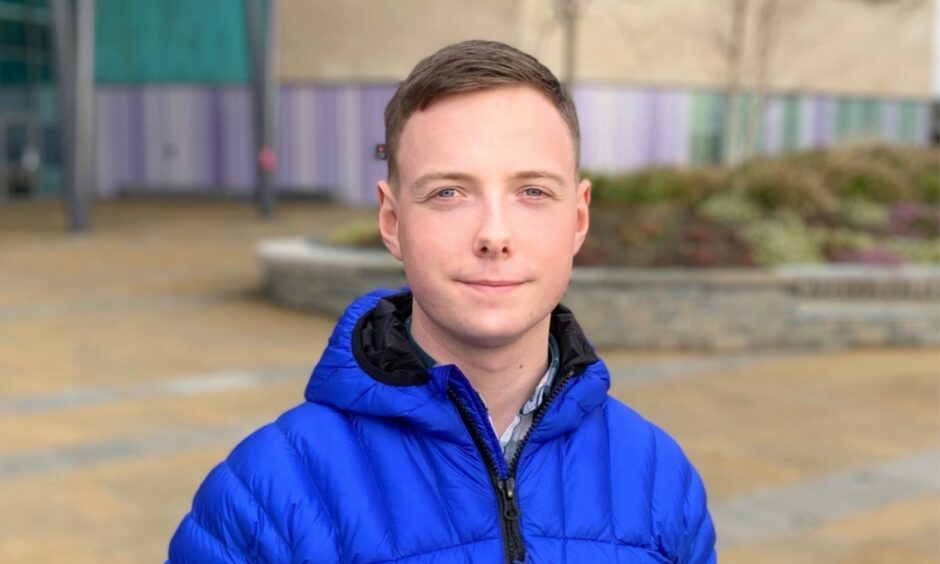
The Inverness study was conducted by George Gunn, a climate change strategy officer with Moray Council and an associate researcher at the University of the Highlands and Islands.
Mr Gunn, originally from Brora, said the effect on temperature is down to how Inverness has grown, including an increase in compact housing developments.
“As someone from the Highlands, the growth of Inverness has always fascinated me.
“I see this continued expansion of the city and wonder what impact that is having.”
Study could help future planning
He suggests increasing the amount of green space and developing nearby towns and villages rather than the city.
“I would argue that investing in existing towns and villages, making them more attractive places to live, and commuting to Inverness, would be a step in the right direction.”
He said there is scope for improving public transport and investing in projects such as the electric vehicle charging network.
Mr Gunn re-analysed data gathered from June to August 2019 as part of his undergraduate dissertation at UHI Inverness.
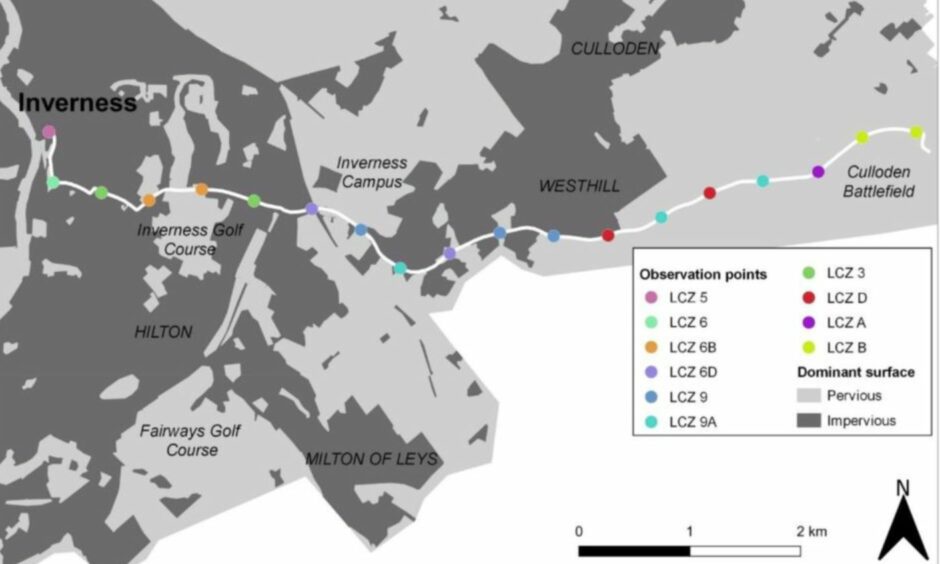
A vehicle-mounted sensor was used to measure temperatures from 19 areas between Inverness and Culloden.
He hopes the findings of the research, which have been published in the Scottish Geographical Journal this week, can be used to inform strategic planning strategy.
Mr Gunn added: “The average temperature difference between Inverness and its surrounding areas was 1.6°C, rising to 3.5°C on some occasions.
“This may not seem like a huge amount, but when you look at it in the context of climate change, it could have serious implications in the future.
“The collective impact of climate change and the urban heat island effect could see average summer temperatures in Inverness rise by up to 7.4°C by 2080 compared to those in more rural areas.
“This can lead to higher air pollution, exacerbating respiratory conditions like asthma, as well as increasing the risk of heat-related illnesses.
Rapid urbanisation of Inverness
“Inverness has experienced rapid urbanisation in recent years so it’s crucial for us to understand how this is impacting the local climate.
“Strategic planning should consider proper placement of green space and the density, form and materials used in developments to provide a healthier, more sustainable environment for residents.”
Ken Gowans, vice convener of Highland Council and chairman of the economy and infrastructure committee, said: “Highland Council welcomes the study and hope that Mr Gunn and the University of the Highlands and Islands might wish to contribute to the evidence base for the new Highland Local Development Plan to allow this to be factored in alongside other considerations related to supporting and planning for the current and future needs of communities.”


Conversation